Satellite analyses of offshore waters simplify pinpointing major ocean-circulation features likely to hold fish and are shortcuts to fishing success.
ROFFS and SiriusXM Marine’s Fish Mapping are two major subscription-based companies providing highly detailed oceanographic analyses to anglers.
Sea-Surface Temps
Water-surface-temperature breaks indicate a change in the norm. This might be a variation of a half to a full degree off South Florida and the Keys; a few degrees or more off the mid-Atlantic and Northeast during April, May and June; and a 1- to 2-degree variation in the eddies in waters abutting the Gulf Stream. In the Gulf of Mexico, it could be a 1- to 5-degree difference in winter through spring, and a 1- to 2-degree variation off Southern California.
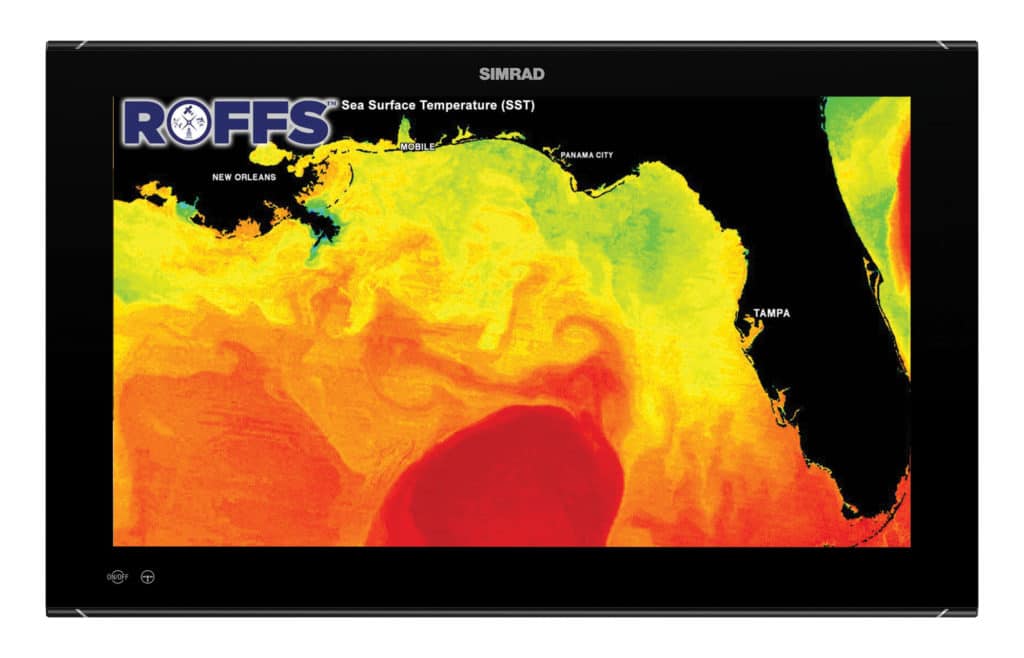
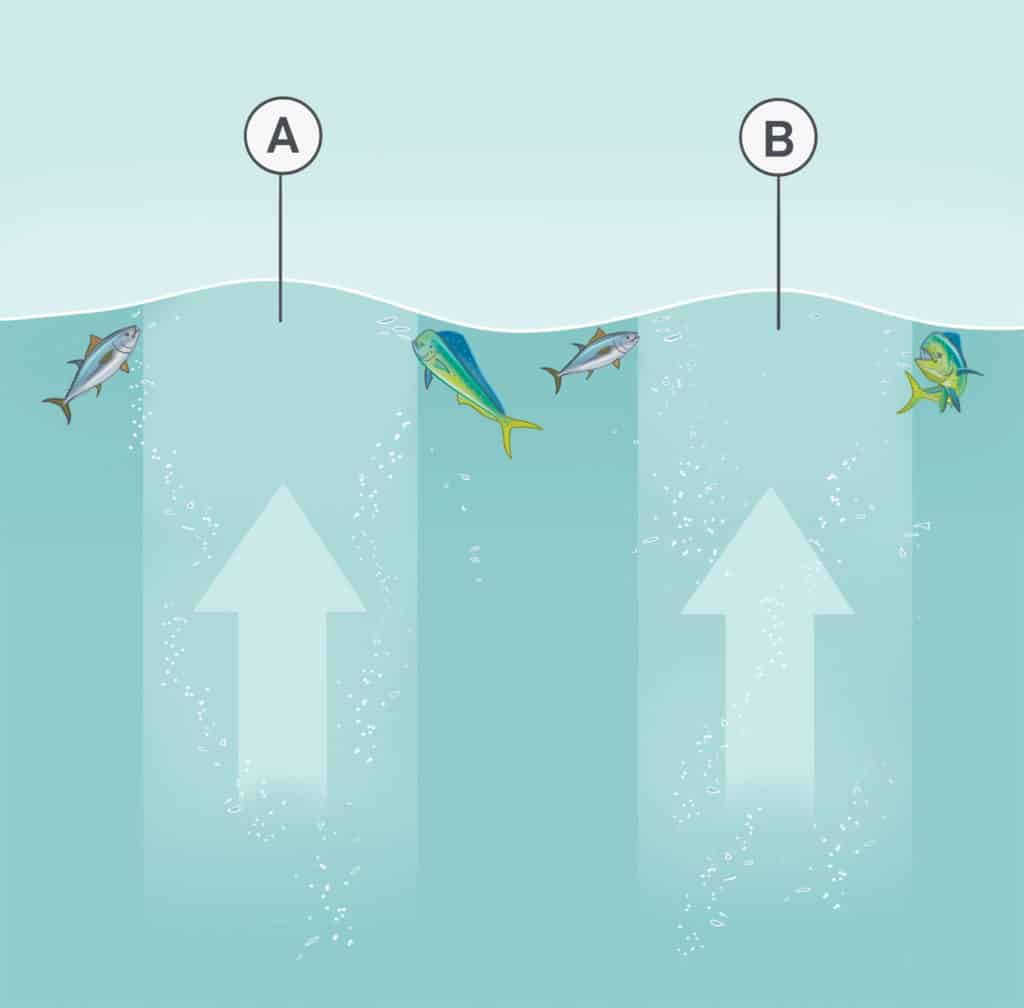
When tropical water from the Loop Current, Gulf Stream or an eddy strikes a hump, canyon wall or similar feature, upwellings occur. Cooler water pushes up nutrients, establishing a mini ecosystem with bait and gamefish.
Such breaks can also signify edges of converging or opposing currents, rips and color changes.
ROFFS analyses include an oceanographic map and comprehensive description. Temp breaks with the highest likelihood for success are pinpointed, along with the time they’ve been parked over bottom, with designations such as “2” for 48 hours and “3” for 72 hours.
Eddies spinning off the Gulf of Mexico’s Loop Current, and the Gulf Stream off the mid-Atlantic and Northeast tend to remain stationary longer than Gulf Stream spinoffs along Florida. The longer a temperature break remains in place, the richer that mini ecosystem.
SiriusXM Marine’s Fish Mapping delivers data and weather to a boat’s multifunction display. Fish Mapping categorizes temperature breaks as SST Fronts (for “Sea Surface Temperature Front Strength”) and SST Contours. The former indicates stronger temperature gradients, e.g., edges of the Loop Current, Gulf Stream, eddies and upwellings. SST Contours track the temperature gradient. Both SST Fronts and Contours are color-coded and include numerals designating their strengths, ranging from 1 (weak) through 4 (strong).
This Fish Mapping feature updates every three hours. ROFFS updates every 90 minutes.
Chlorophyll and Plankton
Chlorophyll concentrations mirror plankton levels. Concentrations establish feeding stations for whales, baitfish, squid, porpoises, and pelagics like tuna, billfish, mahi, wahoo and sharks.
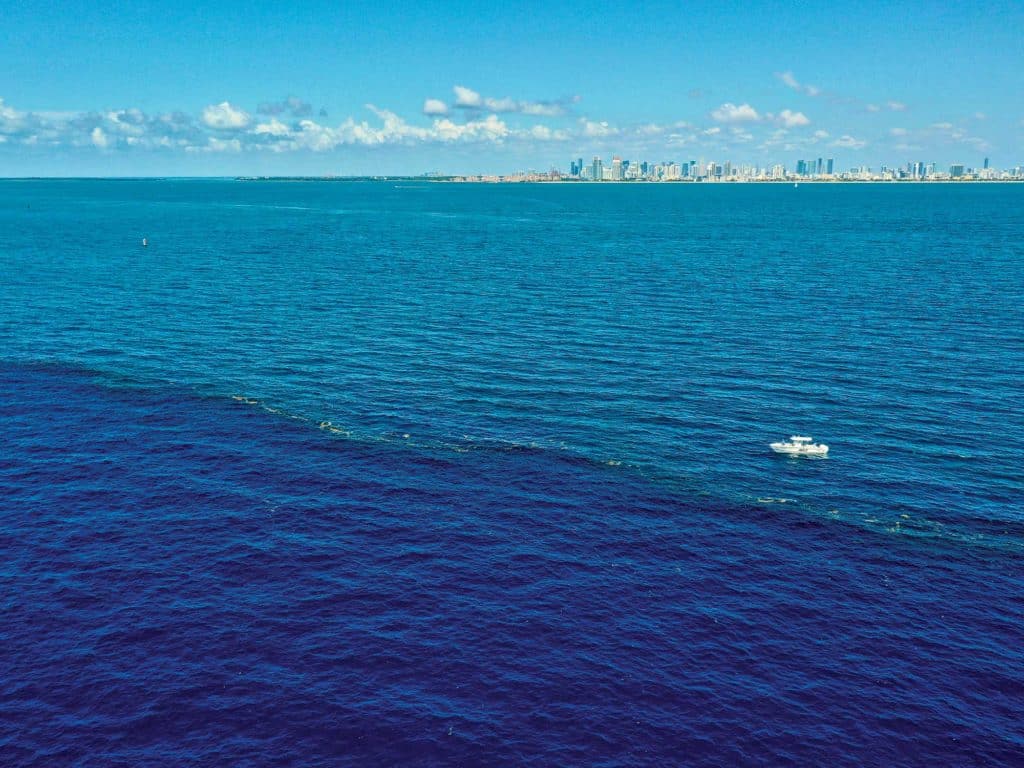
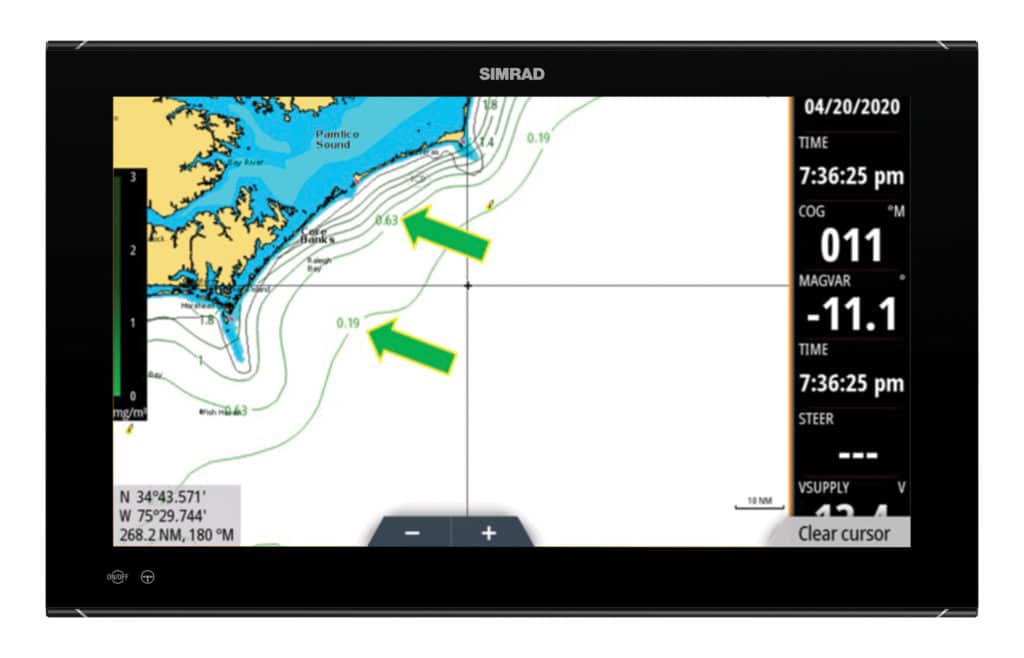
High chlorophyll and plankton concentrations give rich waters an off-color appearance compared to waters with low plankton levels. A high chlorophyll-plankton concentration next to a temperature break has even more potential due to the additional nutrient infusion. ROFFS chlorophyll zones range from red (highest levels) to dark blue (low concentrations).
Like its SST readings, SiriusXM’s Fish Mapping lists Plankton Front Strength and Plankton Concentration Contours. Fronts represent the strongest plankton changes, whereas contours reveal a tracking of plankton concentrations.
On a recent mahi trip in the Florida Keys, Fish Mapping showed a plankton front with a “4” (strong) designation beyond 600 feet of water. Upon our approach, flying fish showered around our boat. The water was dusty blue, not the Gulf Stream’s normal cobalt. More flyers convinced us to troll a pair of flat lines; shortly after, we were into a school of mahi. The scenario repeated farther offshore at another plankton front, with more mahi and working frigate birds. Had it not been for those plankton fronts, our search would have continued seaward.
This Fish Mapping feature updates every 24 hours. ROFFS updates several times daily, with each satellite pass centered around noon.
Weed Lines
Weed lines are sought-after targets, especially for mahi. Studying a ROFFS analysis for water-temperature breaks and even observing the edge of the Gulf Stream itself have uncovered plenty of weed lines as well as debris for us because both collect along those edges and the edges of other ocean-circulation features.
A game-changer is SiriusXM Fish Mapping’s weed-line function. Satellite imagery marks the whereabouts of weed lines, potentially saving anglers a ton of fuel and time. However, the proximity of the Gulf Stream to the populated South Florida coastline can interfere with weed-line readings in this area and out to around 25 miles. Readings resume off the lower Florida Keys and Bahamas, and as anglers head north beyond southeast Florida, as well as off other destinations with a greater distance between large population centers and offshore waters. Experienced observers can still follow indications of the ever-changing weed lines close to the coast.
As far as accuracy, given the 24-hour update cycle, fast-traveling Gulf Stream, wind and other factors, Fish Mapping provides imagery from the previous three days. Therefore, a subscriber can predict where weeds will be found based on trends.
Read Next: Satellite Data and Fishing: Eyes in the Sky
Subsurface Readings
Thermoclines are convergence zones beneath the surface. They vary in depth and appear on a sonar as horizontal lines at a specific depth. These are good targets for setting baits for mahi, tuna and sharks.
Fish Mapping’s “30-Meter Subsurface Sea Temperatures” feature provides readings at around the 90-foot mark. For example, when cold-water upwellings cool the water and shut down grouper and snapper feeding, anglers have the option of running, checking these temps, and possibly finding relief from these cool infusions. On the flip side, cobia often move in with such upwellings. And during the heat of summer, baits can be placed in cooler zones and also near a thermocline. Remember, fish feed best in their most comfortable temperature zones.
Sea Height
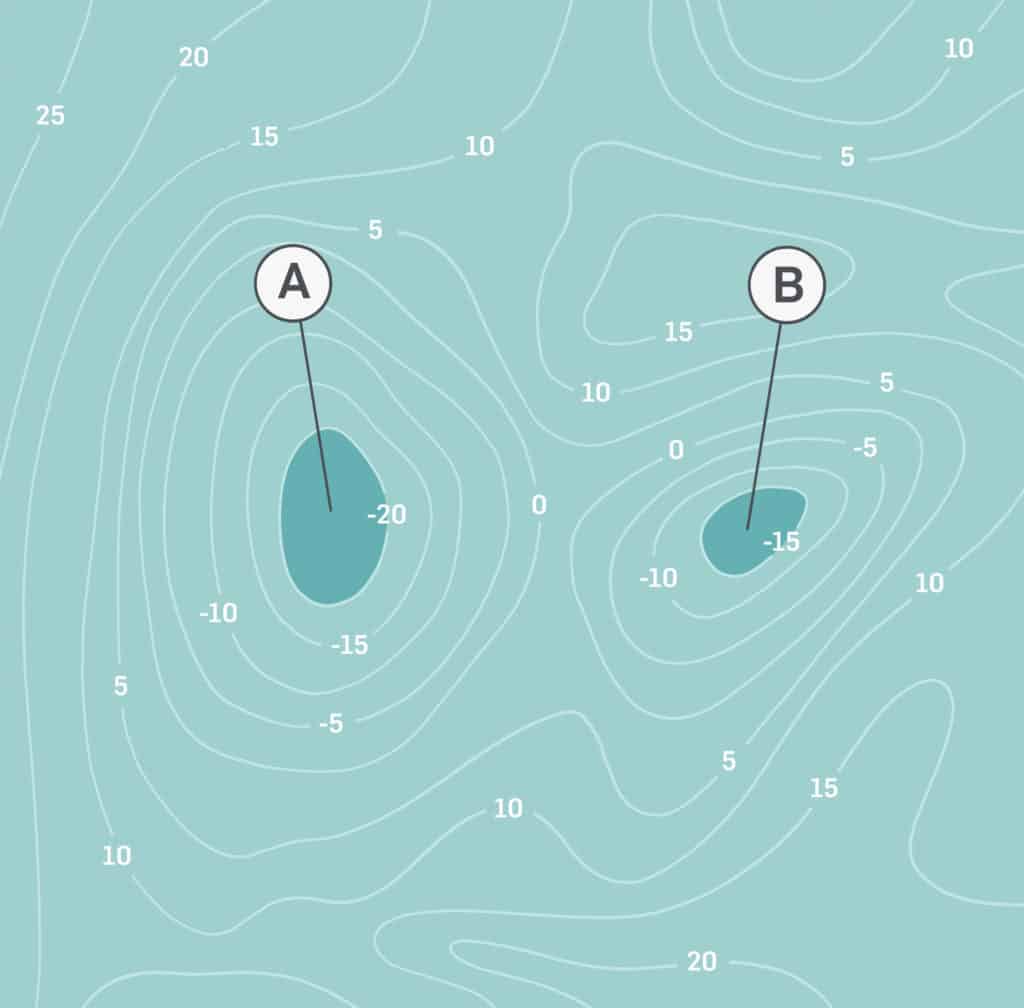
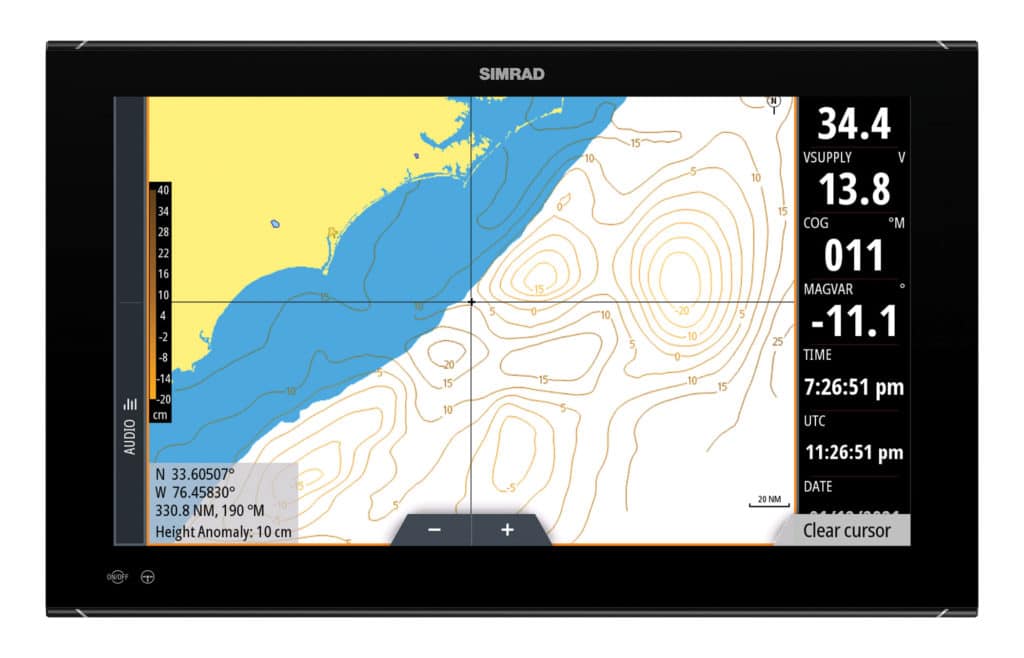
Available through ROFFS (“Altimeter”) and Fish Mapping (“Sea Surface Height Anomaly”), sea-height readings reveal areas where sea-surface heights differ from surrounding waters. Examples include spikes in sea heights from rips, eddies, strong bottom upwellings and opposing currents. Again, it’s the nutrient-rich upwellings along these zones that call in gamefish.
Conversely, the low or down sides are also noted, such as where an eddy pulls from inshore to offshore, like the far back side of an upwelling. These zones generate less nutrient accumulation and fewer gamefish. Sea-height readings are good intel when weather conditions prohibit clear satellite imagery of sea-surface temperatures and chlorophyll and plankton concentrations, and in areas where sea-temperature changes are weak.
Locating offshore pelagics requires far less homework with these subscription services. Just boot up the analyses, drop the cursor on a highlighted zone, and run to it. Concentrate on as many of these features as possible, and you’ll spend much more time at the fish-cleaning table.
Satellite Intel
Both ROFFS and SiriusXM Marine’s Fish Mapping offer even more fish-locating intel. Check out their full line of services at siriusxmcommunications.com, 844-342-0665 and roffs.com, 321-723-5759.

